If you’ve ever tried to measure customer health without a CRM, you know it’s like trying to do heart surgery with oven mitts.
At Nexcraft, we’re not using a traditional CRM like Salesforce or HubSpot. Since we're small, we’ve kept things light — PostHog for usage data, a Notion database for accounts, and a shared Slack channel for internal updates.
But we still need to know:
Which users are thriving?
Who might churn?
So we built a flow in Nexcraft that tracks customer health across our stack without CRM.
Now we get weekly reports on each account’s engagement, product usage, and risk factors.
Automatically. Consistently. Insightfully.
Here’s how it works:
💔 The Problem: No Visibility Into Customer Health
Before this automation, here’s what customer tracking looked like:
We manually reviewed PostHog dashboards for top accounts.
If someone hadn’t logged in for a week, we might notice.
Support pings would occasionally act as a churn warning.
No consistent definition of “healthy,” “at risk,” or “churned.”
No shared view across the team.
We had no pulse on account engagement. We were flying blind.
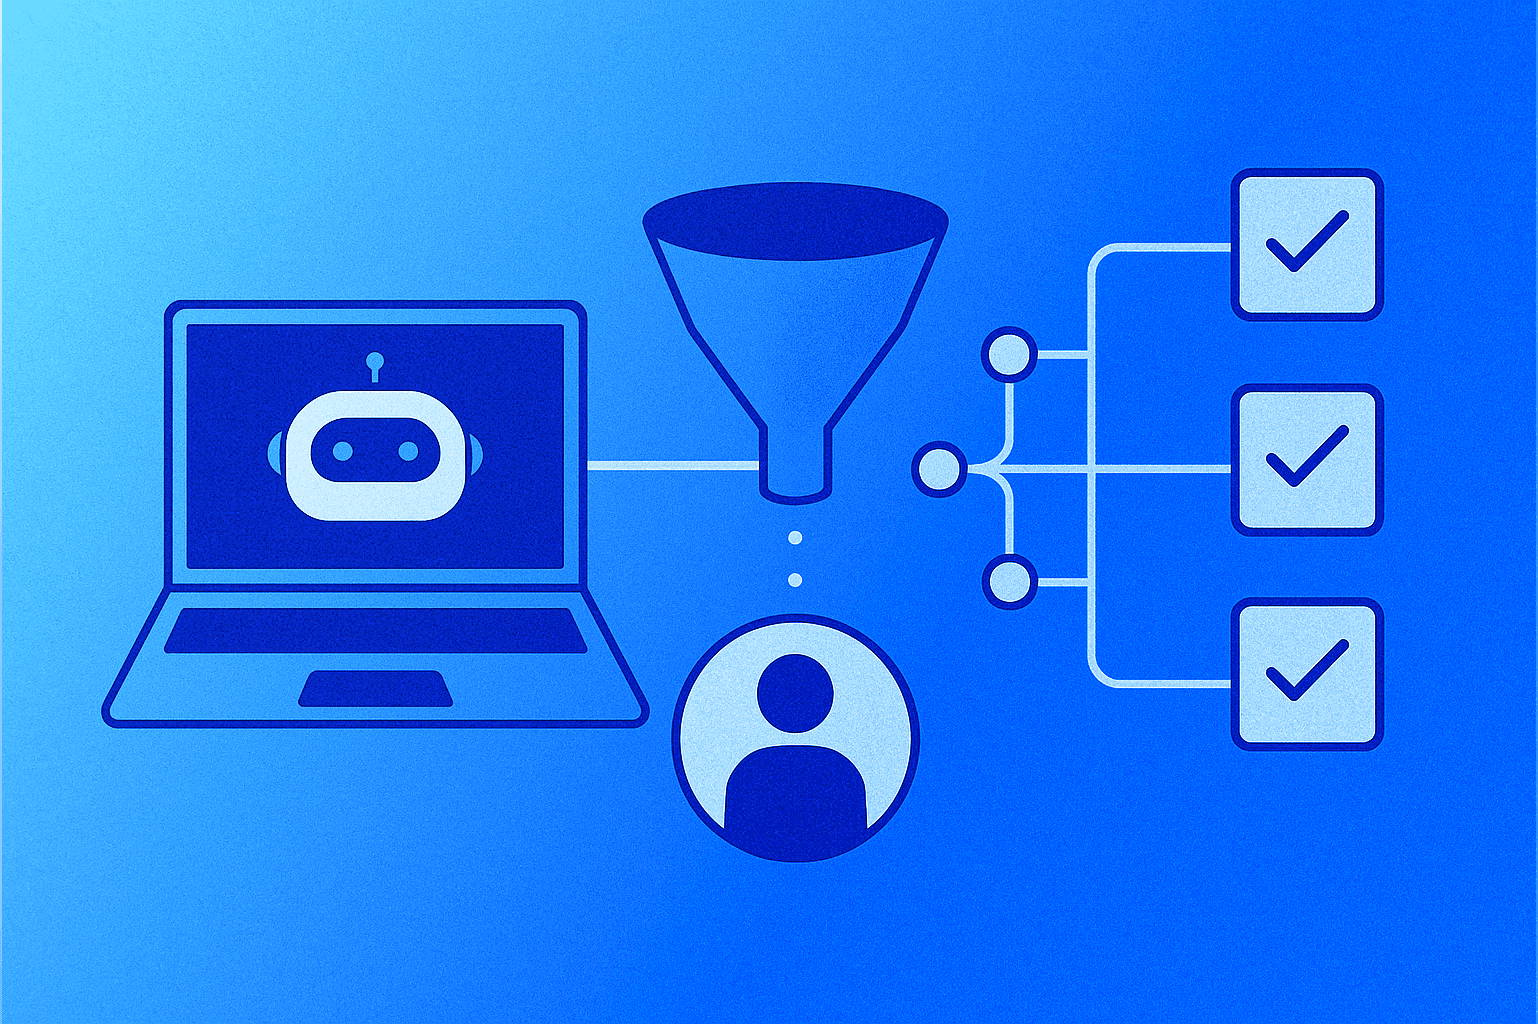
🎯 The Goal: A CRM Free, Automated Health Monitoring
What we wanted:
Track product usage patterns for each account
Identify risk signals (drop in usage, no agents built, etc.)
Categorize accounts as Healthy, At Risk, or Dormant
Deliver weekly updates to our
#nexcraft-updatesSlack channelLog historical health data in Notion for longitudinal tracking
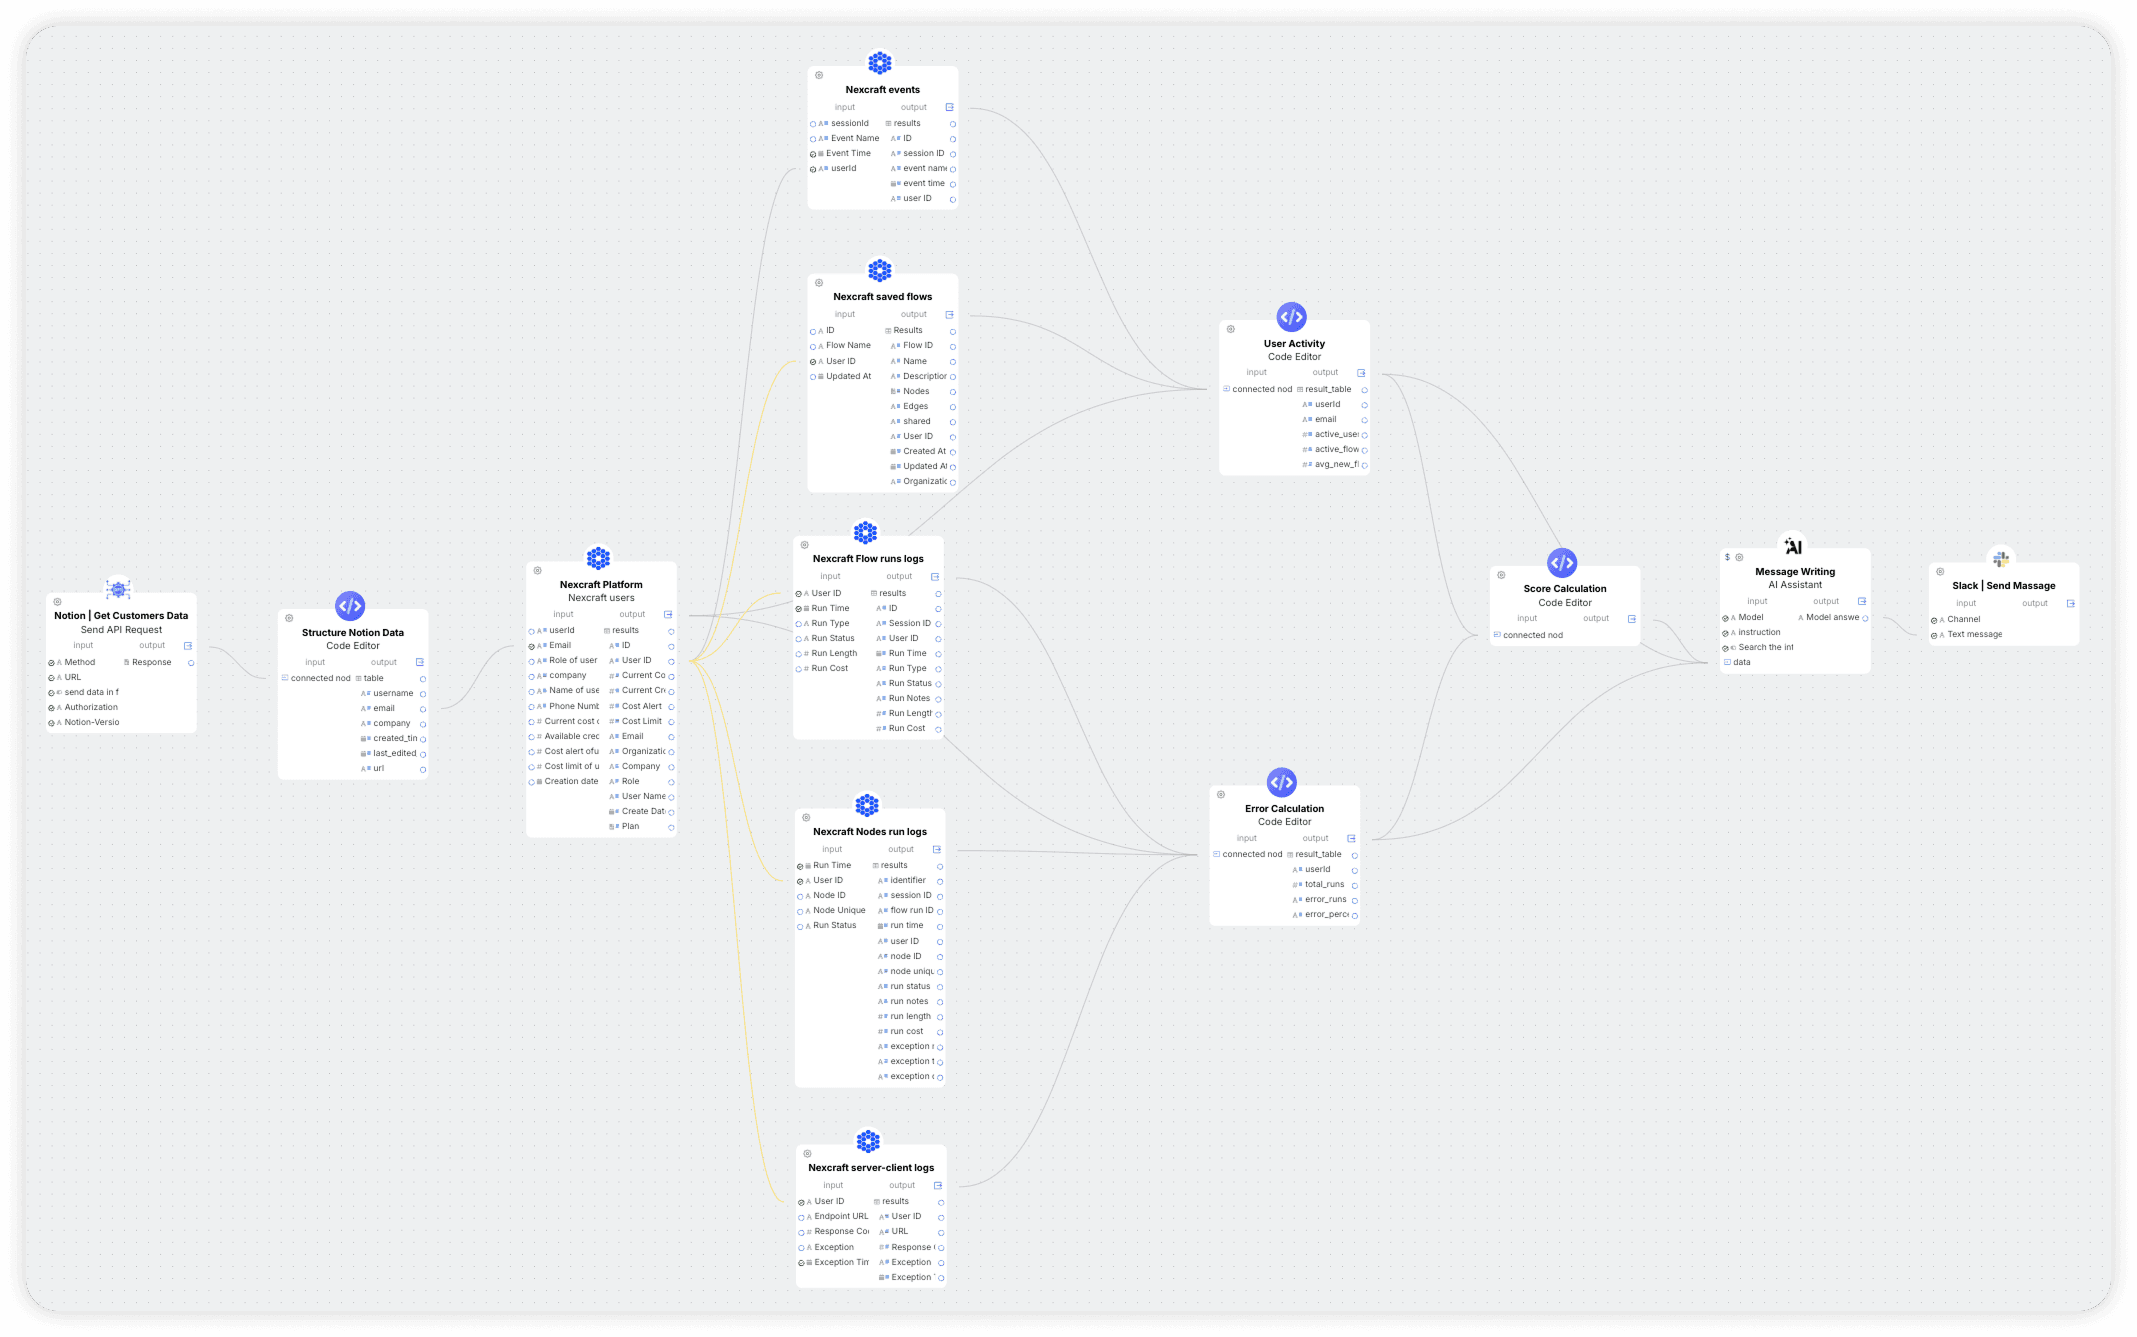
🧠 The Setup: Customer Health Flow
Here’s how we built our heartbeat monitor for customer engagement.
Step 1: Define Health Criteria
We created a simple scoring system based on sum of the following behavioral signals:
Number of "Active user" in the last week
Number of Active (Scheduled) Flows
% of errors out of total runs the user did in the last week
Avg. Number of new flows built per day in the last week
Score of:
10+: Healthy 💚
3–9: At Risk 🟡
≤ 2: Dormant 🔴
Step 2: Connect to PostHog + PostgreSQL
The agent pulls weekly usage data from PostHog (logins, flow runs, flow saves) and error logs from our internal Postgres DB.
Step 3: Sync with Notion Account Tracker
Each account is listed in Notion with:
Company name
Plan (free, paid, POC)
Link to user emails
The agent joins the usage data with the corresponding Notion record.
Step 4: Calculate Score + Flag Accounts
Each Friday at 10 AM, the agent:
Applies the scoring model
Flags any accounts that moved between segments (e.g., Healthy → At Risk)
Logs notes like “no logins in 10 days” or “increased usage this week”
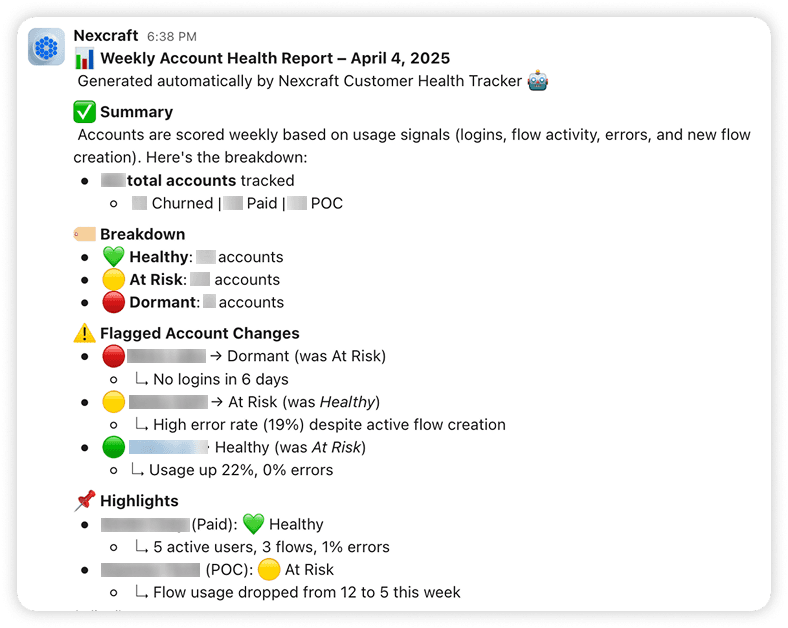
Step 5: Post Summary to Slack
The output gets posted to #nexcraft-updates:
📈 The Results: Early Detection = Better Retention
⏱ No more weekly manual checks
We now get customer insights without touching PostHog or spreadsheets.
📉 Fewer surprises
We’ve already prevented two silent churns by catching usage drops early.
📊 Longitudinal view
With weekly logs in Notion, we can start correlating features released with usage spikes or drop-offs.
🧪 What We Learned
Health isn’t binary, small changes can signal big risk.
Behavioral data is more reliable than “sentiment” from calls.
🧠 Nexcraft Prompt (Take It)
“Pull weekly usage data from PostHog and error logs from our database. Score each customer based on our health criteria: {write_your_criterias_here] . Post a summary in Slack with accounts grouped into Healthy, At Risk, and Dormant.’”
🚀 Final Thought: Stay Close to Customers without CRM
CRMs are great, but they’re often bloated, expensive, and still require manual input and configuration.
We built our own version using Nexcraft. Lightweight. Real-time. Fully automated. And honestly? Smarter.
Because what matters isn’t that you track customers.
It’s that you notice when something changes and act fast.